November Fund Performance
Santa needs a rest before he gets to work

Hi Everyone,
Another year done and dusted. Whether you’re reading this from the office or already scrolling from the beach , I wanted to send a quick note of appreciation.
I hope you and your families have a beautiful holiday filled with good food and great company.
Cheers,
V
PS - Merry Christmas ya filthy animals
See below month end fund performance data ranked by monthly performance.
HOUSEKEEPING
If you want to read this on another site with interactive tables that you can click through on, click below:
Seriously, it’s much nicer - CLICK HERE
If you are receiving this via email, I suggest clicking the link and reading directly on Substack. The email formatting does not translate well and the information may appear as clipped or truncated in your inbox due to the size and length of the Substack post.
If this forwarded to you, feel free to respond to the Substack email or just send a sign up request on mrquick@substack.com or contact@ausyield.com.au
All tables are sorted by 1-month performance, with benchmark rows highlighted where relevant.
Fixed Income
Bond funds right at the bottom for 1yr+, and this is before the big run in yields
You know 6 months ago, the Aus 2YR was 3.275%, its over 4% now
As I said last month, chance of rate cut is zero.
We need more inflation data and I know there is lots of noise around policy, but the reality is the average person’s hip pocket doesn’t care about policy or the nuances or inflation.
Price level increase = pain.
A question of how much exposure do you have to non-inflation linked securities that generate yield?
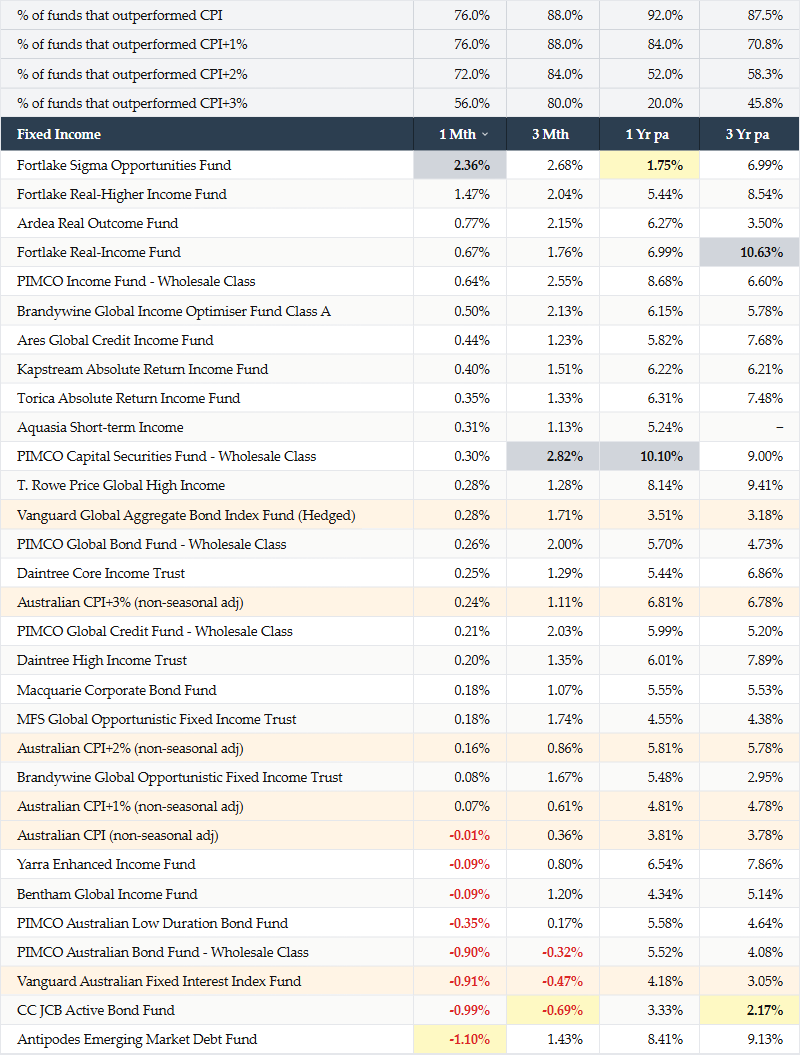
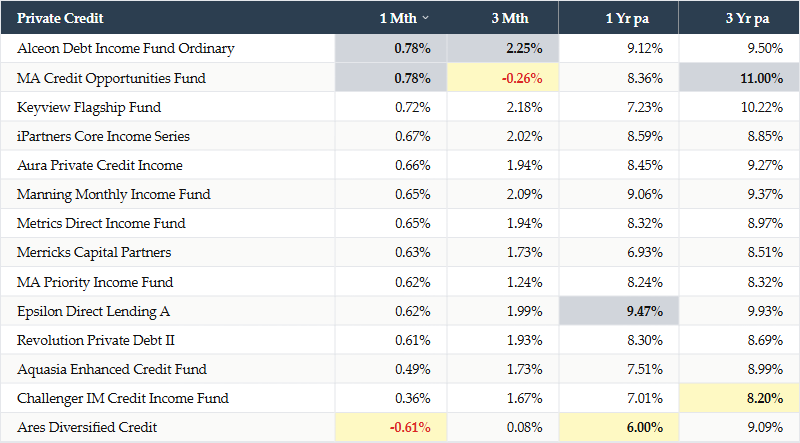
Private Credit - Domestic
If you look at 3yr returns, there is little difference in outcomes between private credit and the higher yield/higher risk funds in the above Fixed Income table.
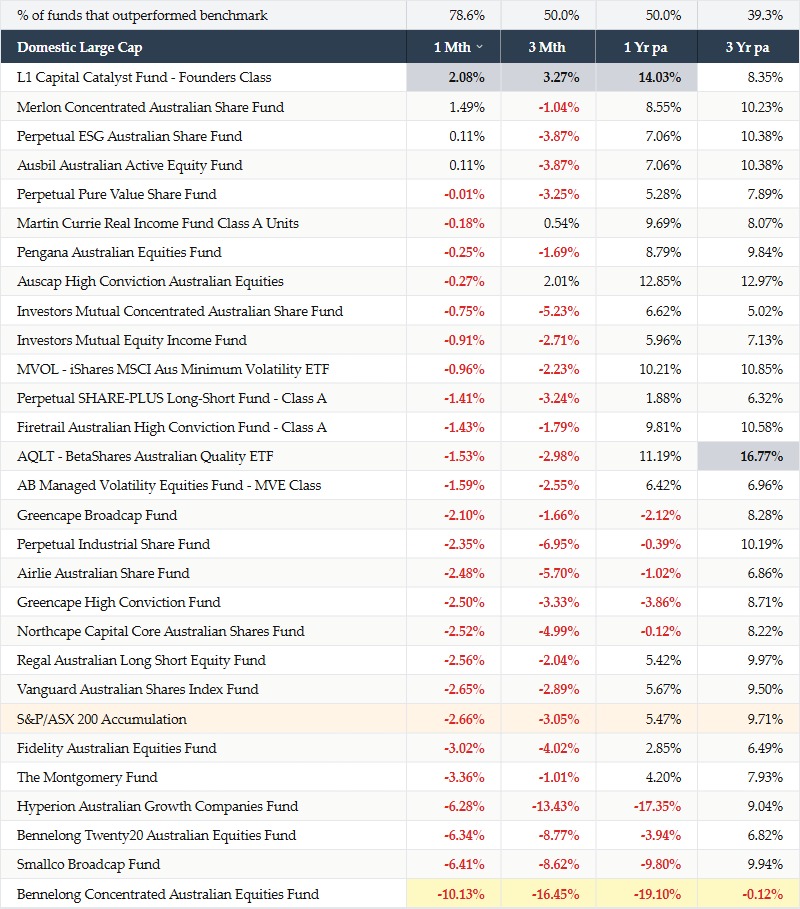
Domestic Large Cap
One of the more disgusting months I’ve seen in a while where many funds got hit by a name or 2.
Funnily lots of those that got hit were concentrated managers who held a name that blew up.
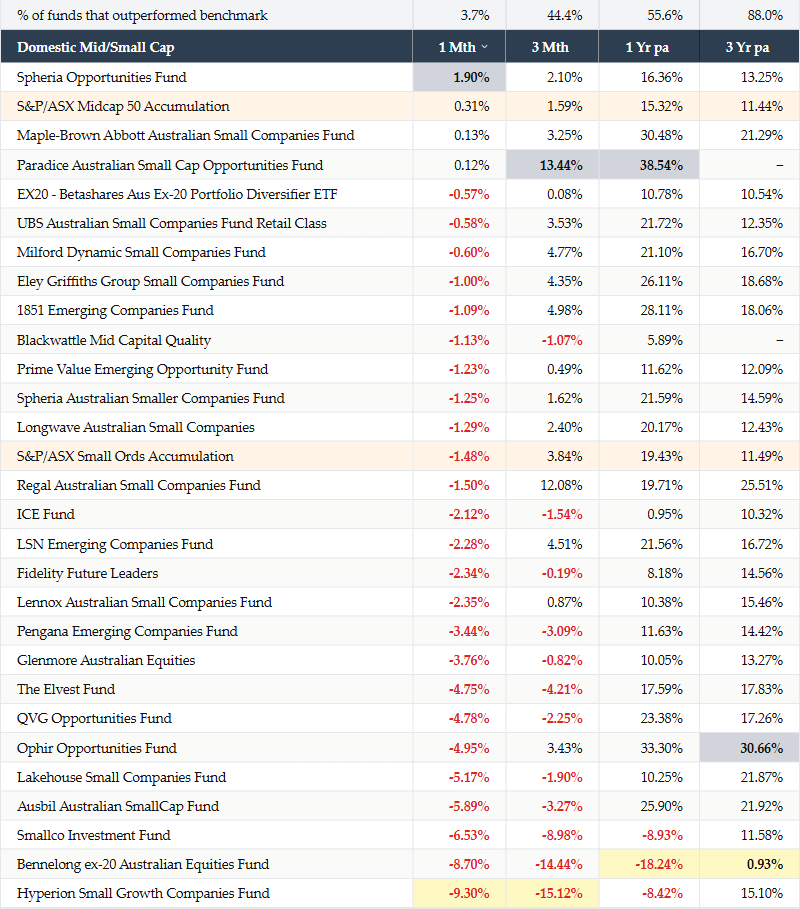
Domestic Mid/Small Cap
Much like the above concentration + some of the small cap favourites took a breather.
Gigantic difference in outcomes, Paradice utterly murdering performance.
Bennelong blow up goes from bad to worse. 38% delta vs the benchmark
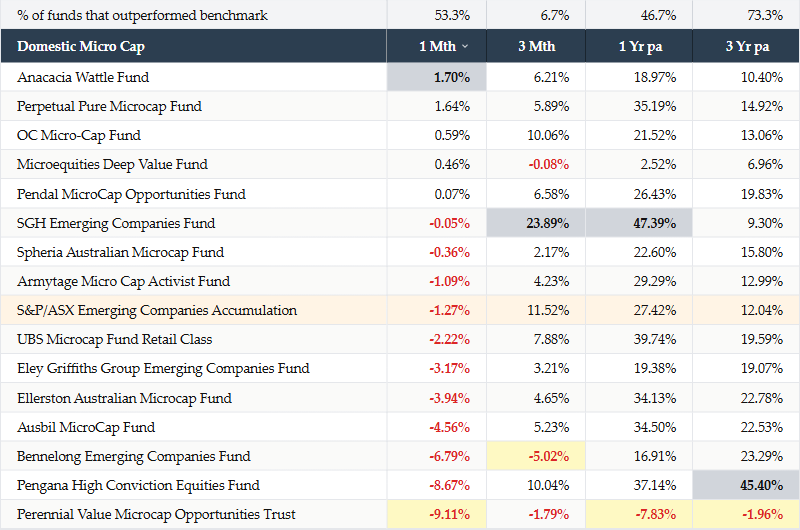
Domestic Micro Cap
Micro caps continue to work. Most exciting part of the market.
Bennelong fund unfairly wrapped up in the bennelong debacle
Perennial. Dude. How are you losing money in this environment?
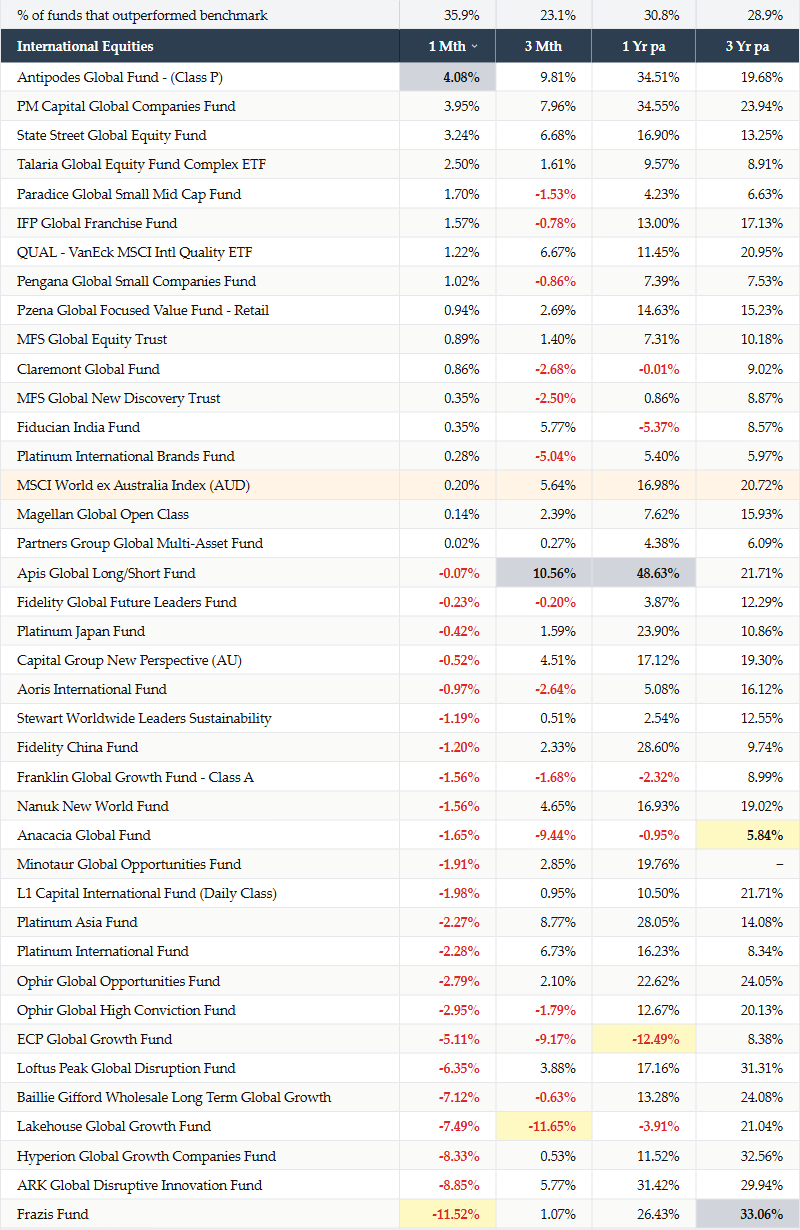
International Equities
Finally some dispersion this month with the big AI names taking a breather(ish).
On the AI plays (ie Mag7 et all), there is a huge performance differential between the OpenAI related names (MSFT, NVDA, ORCL) and the Google+Anthropic names (GOOG, AMZN, ACN).
The group of companies that are rallying at any given time seem to be the ones exposed to the leading model.
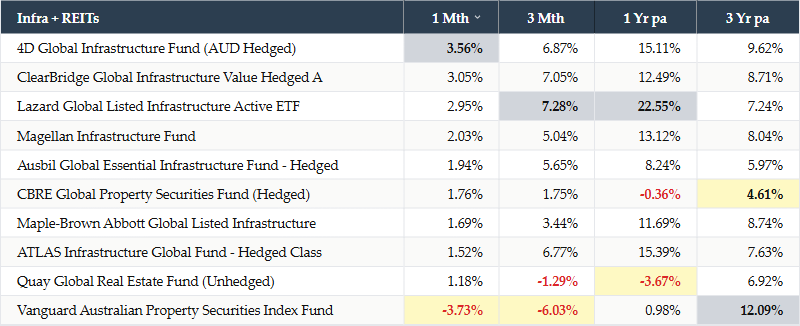
Infra + REITs
A-REITs copping a walloping now, higher 10-year yields in Aus flowing through to valuations.
If you have a view on Aussie rates and them going lower at some point, a nice little reminder that this is one of the more levered ways to play the space.
Forget defensive vs growth, if we’re talking rates going up it hits everything the whole way down because everything has its own duration, then do you hold fixed income or this stuff? What has a better real rate outcome?
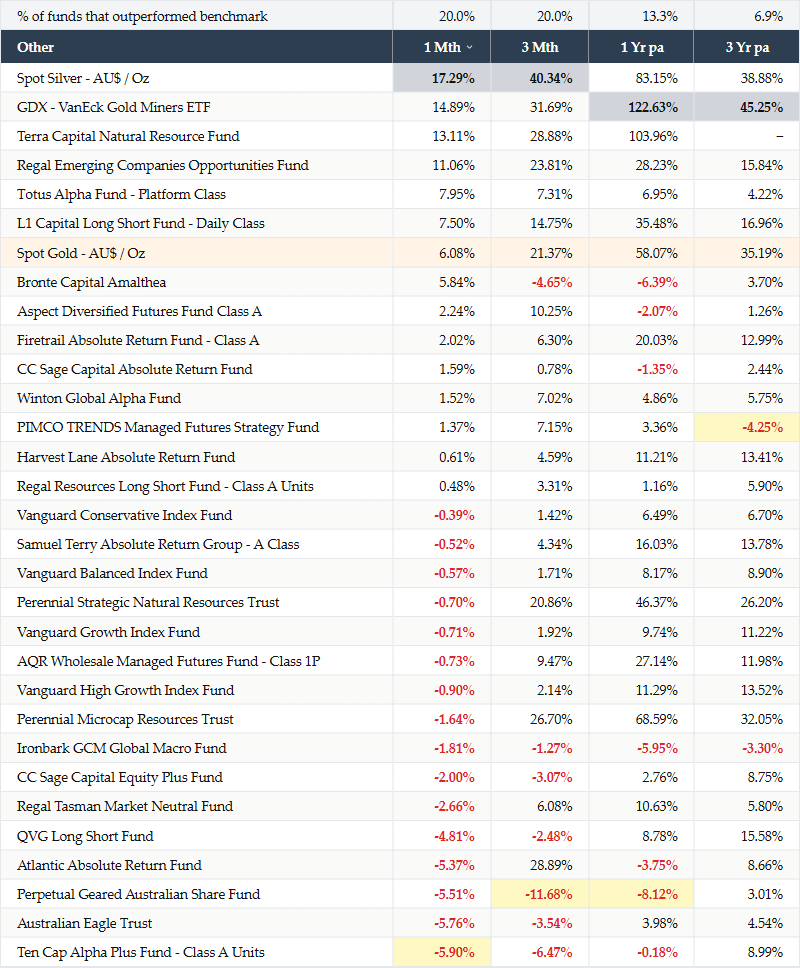
Other
Gold and Silver, jeez
I’d argue that GDX is still immensely cheap here compared to where Gold $ is today
Long Short funds that were short CBA finally killed it, you can almost tell who was short CBA as it hid some of the poorer mid-cap performers.
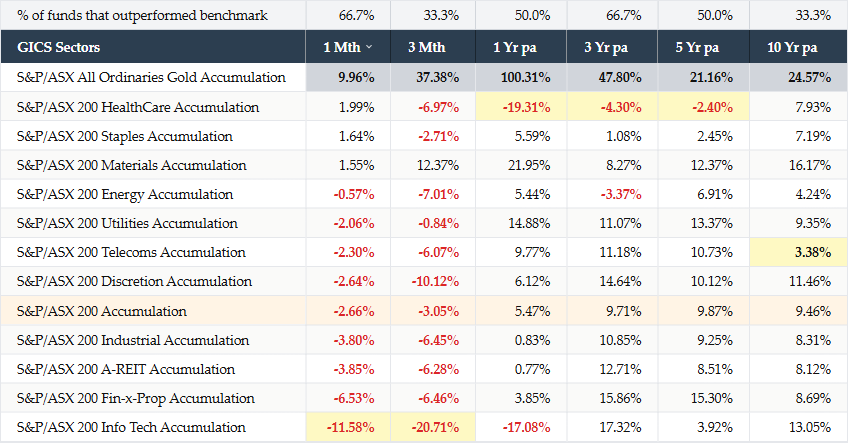
GICS Sectors
Gold Index is +100% over a year and +25%pa over 10 years, that is a 10 bagger in 10 years. This is the index we are talking!
The healthcare debacle, now the worst performing index over 1, 3 and 5 years.
Can you believe it’s even underperformed Energy?
The Nasdaq might be up ~21% over the last year, but our tech sector has managed to underperform by almost 40%!
Thanks Richard...
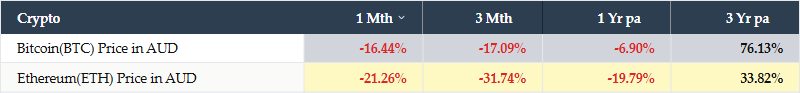
Crypto
I wrote enough last month, if you think that we get back to ATH, you’re underwriting sort of 30-40% capital returns
But plenty of downside risk!
Thoughts of the month
A Hill to Die on
There is a chart that I believe represents the ultimate form of chart crime, one that fund managers, allocators, advisers, and consultants all use to look clever.
Apollo just released their latest version. Apollo nicely insinuating that you should sell public equities for private markets. And boy do they have something to sell!
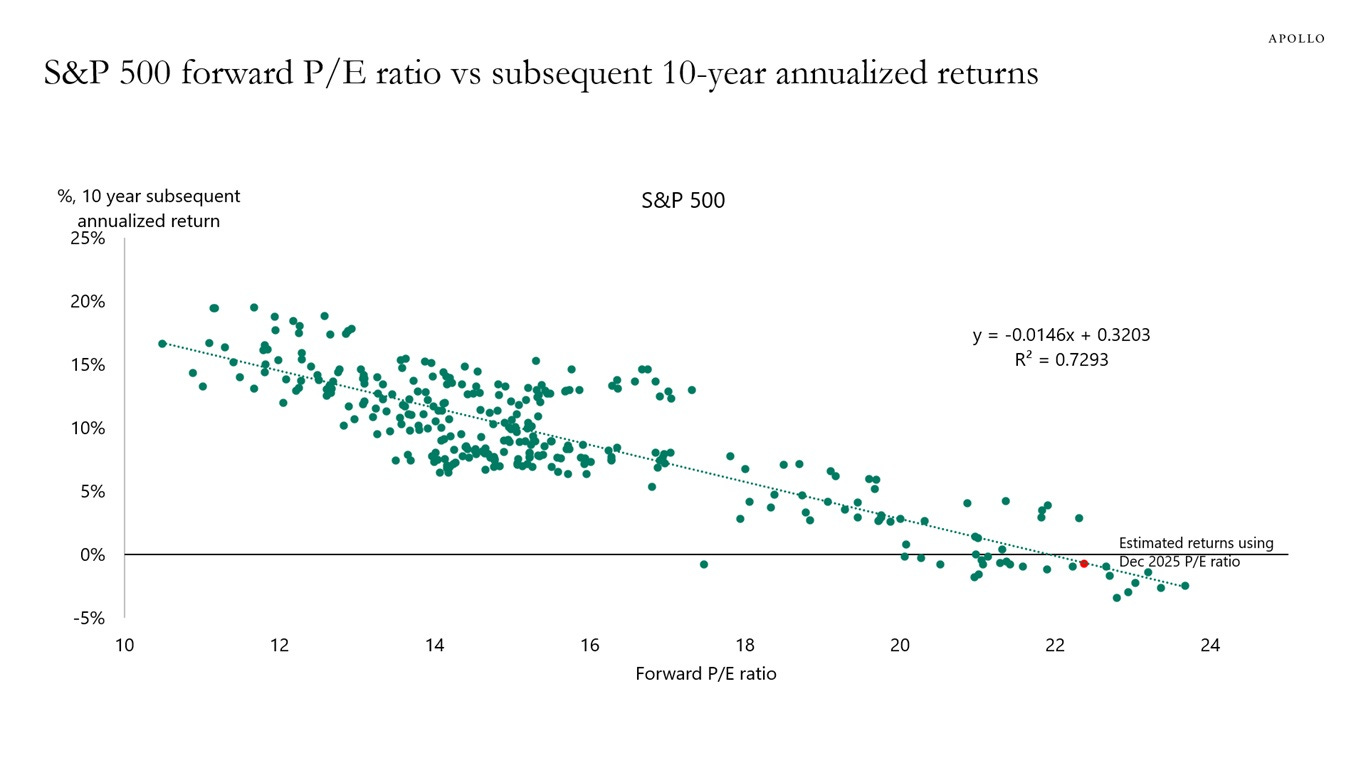
So, by this chart, emphatically forward returns for the next decade will be 0%.
Maybe? Maybe not? I do not know and neither do I care (okay maybe I do), but what I don’t like is using it to make overarching predictions.
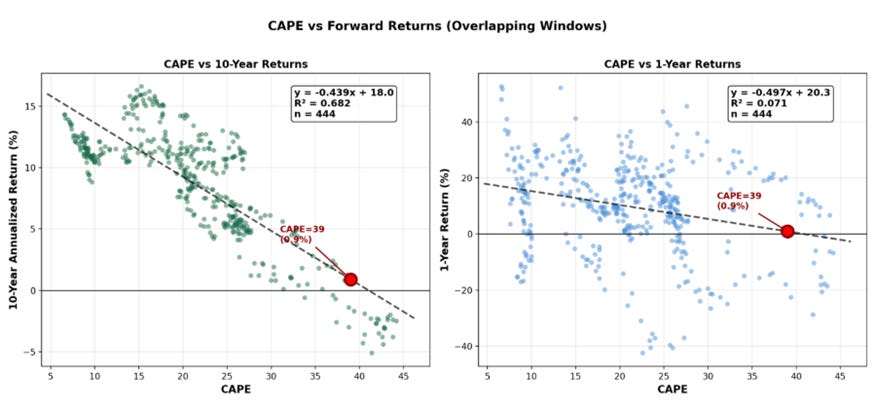
When charting a relationship, you hope your data points are independent as precision and robustness relies on independent observations. If one observation shares 9 out of 10 values with the next observation, how independent is it really?
Serial correlation, autocorrelation, call it what you want! The R-squared is so high because almost every data point overlaps with its neighbours. The January 2010 data point shares 9 years of returns with the February 2010 data point, which shares 9 years with March 2010, and so on.
If you flip it the other way, what happens when you reduce the overlapping window?
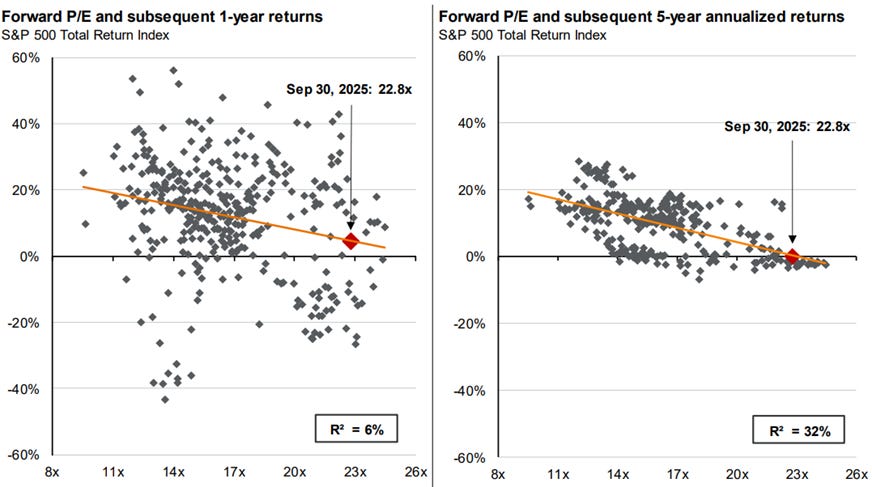
At 5 years, R-squared drops to 32%. At 1 year, R-squared collapses to 6%. Thank you, JPMorgan, for showing us what everyone else obscures.
Forward looking 1yr +20% to -20%...
Okay some more charts from me, this is charting Shiller CAPE from 1980 onwards using monthly data:
And what if we swap out CAPE for trailing PE ratios for the S&P500? However in this one I show you what non-overlapping, independent observations look like:
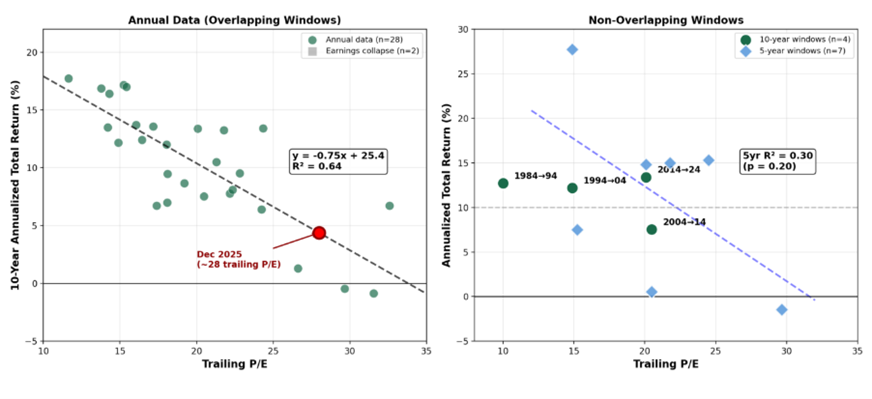
How many non-overlapping periods since 1880? 14 (ish?) Fourteen! That’s astrology! That’s not even enough data to draw lines on a chart!
Let’s go one step further. We know what returns projected by CAPE were, and know the actual realised returns, so why not compare the projected vs realised returns?
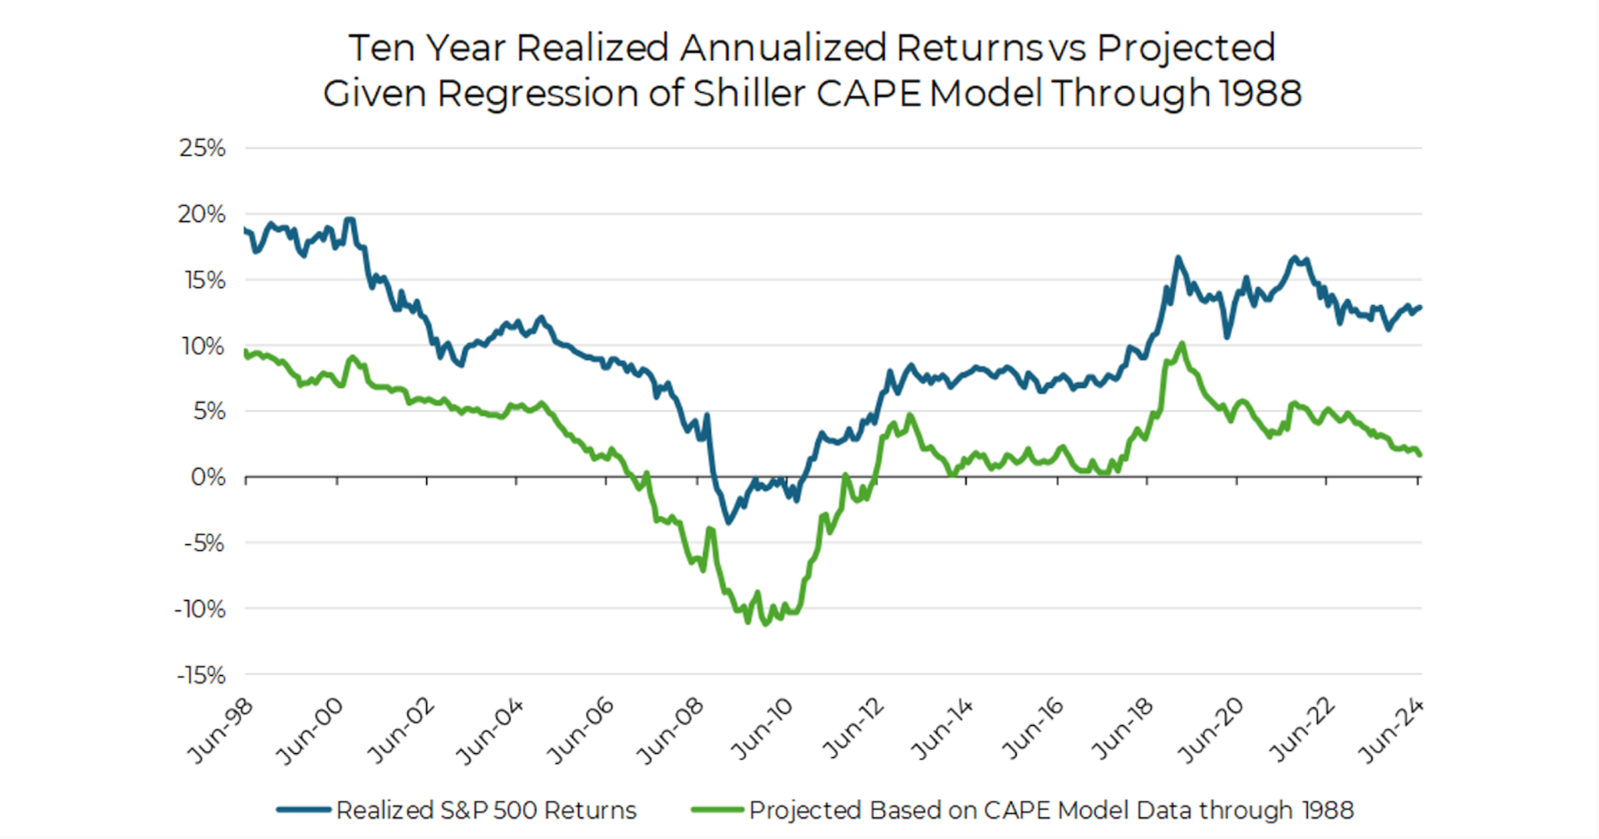
Aptus Capital Advisers have kindly done this for us and realised returns are usually 5-10% above the projected returns based on CAPE data.
PE ratios & CAPE are challenged when comparing data across long periods of time. There has been significant changes to how goodwill, D&A, capex, stock-based comp and a few other bits & bobs are calculated. The PE ratio in 1980 and today in my view are not directly comparable.
I’m not saying forward returns aren’t going to be zero, but it’s worth taking a beat and acknowledging the crimes of this chart and that it is being advocated for by a private markets manager.
One final observation, if Apollo genuinely believes public market returns will be zero for the next decade, shouldn’t they be trying to monetise their portfolio today? If forward returns are truly zero, why aren’t PE firms dumping everything onto public markets while multiples are still elevated? (1,2)
The chart says one thing. The behaviour says another.
Concentrating on Risk
I’ve written about this before but it’s worth revisiting.
Whenever you hear a portfolio manager at a concentrated fund talk about position sizing based on reward rather than risk, you should get a little concerned. And when that conversation happens after a big drawdown, you should get very concerned.
Playing life on hard mode
Managing a concentrated portfolio is playing active management on hard mode. Each decision matters more. The stakes are higher. One is more susceptible to anchoring, confirmation and overconfidence biases.
Imagine a stock down 20% (or 25%). You need +25% (or +33%) just to get back to even. When the stakes are that high it’s near impossible not to have an emotional response. If you’re reading this, it’s probably happened to you too, you tell yourself you were just early, or the market is stupid, or you messed up the entry and it’s priced in now. And often the right move is to do nothing.
And sometimes the fund doubles down. The position that was 10% of the portfolio is now 15%. The update calls go on for longer, the upside cases more elaborate. And “risk” often totally disappears from the vocab.
Sizing Based on Risk
Sizing based on how much you can afford to lose not how much you think you can make. I keep coming back to this, it really does save you a lot of pain & difficulty.
Everyone will be wrong at some point in time no matter what, so you try and not let the losers sink you. I’ve seen many funds blow up by conviction-based sizing where the focus on maximising expected return instead of minimising losses, combined with concentration, eventually catches up with you.
And blowups do something nasty to judgment. It’s hard to admit you’re wrong when you’ve lost that much money.
What To Listen For
A few things that have always made me nervous:
Someone tells me “we run concentrated and size on conviction”. These two things combined are problematic. People who run concentrated tend to have trouble changing their minds. Blend it with conviction and you get overconfidence.
A PM or analyst spends forty minutes on upside, zero on risk.
“This is now our largest position” (after a drawdown). The position got larger as it fell and they added and is ALWAYS presented as a feature.
Okay this is a tricky one I’ll admit, it works sometimes but eventually you will get one wrong. Happened to me more than I’d care to admit, when someone tells you a position which got crushed is a 10-15% weight and here’s all the upside… eek. You have a small drawdown window before a stock will end up on the wrong side of momentum factor.
Technical selling pressure is a bitch (3).
This is not a complete set of rules and rather a reflection of stuff I’ve seen that has worked in the past. It serves me well and hope it serves others well too. You can apply this to an external actively managed portfolio or your own personal one.
Don’t blow it up!
It’s All Over
Claude Opus 4.5 is the single most significant thing that has ever happened in my career.
Do not take that statement lightly.
This is entirely embarrassing but I need to vocalise it because it needs to be said. The realisation kicked in this month for me as I am slowly coming around to the fact that everything I do on a computer and everything I do on a technical level, AI can do better now.
EVERYTHING.
Yeah yeah its not Artificial General Intelligence (AGI) but we’re 95% of the way there. I don’t need to wait for AGI. What is AGI to me anyway?
Yes, it can’t do my dishes. Yes, it can’t join multiple thoughts together yet because the window for thought is too small. This is all going to change in the future. New discoveries are made because humans interface ideas across generations. Archimedes sat in a bathtub and a couple of hundred years later, we’re floating oil rigs on the ocean. Our knowledge and principles are passed down from one individual to another and the combined exploration & discovery is what pushes our frontier forward.
AI cannot make those connections yet but it will get there. Sooner rather than later.
Everything is indeed, computer.
Thanks
Well done for making it this far and it pleases me you are reading this sentence. I thank you for reading the above and I hope it has provoked some thoughts.
While I take care to make sure data is correct, I do not make any guarantees as to the complete accuracy of these figures. The data and comments above are simply my observations and not financial advice.
For what its worth, I’m more comfortable saying there is a bubble in private markets, not public. OpenAI val is dumb. OpenAI is a private company and frankly if there is one place I can say the words a “bubble” exists in, it is private markets, not public.
Some time ago I was being pestered by “mid-market” PE managers to allocate. Fascinating stuff, why would you allocate to one when every PE fund was looking to buy up listed companies. If PE was acquiring listed companies and the IPO market was dead, it meant that PE thought listed markets were cheap. Look at the ASX, an inordinate number of companies have gone private since 2022. Lends into another idea that private equity and private credit are not “alternatives”. They are equity and credits and they should be competing for capital from those sleeves. Where you can allocate to either private and public managers across all sectors.
I’ve looked at long-short funds for a long time and tried to understand the point of shorting. Generally, in Aus when you see a LS fund, they’re shorting to lever up their longs and usually shorting doesn’t make them alpha. Furthermore, most people are geared to think about making money by going long, whereas shorting absolutely cooks brains. It has its place, shorting reduces vol at some points in time and depends on where you are in the market cap, shorting can be quite fruitful.
I can count on one hand Australian LS funds that have generated positive alpha from their short book.
Now, that is a naive way of looking at things, let’s be completely honest. Not all managers are fundamental, some are systematic. And their short-book alpha is persistent. I’ve looked at fundamental managers my whole life and recently gotten into properly understanding systematic (I’m learning machine learning and XGBoost at the moment, fundamental x systematic is the future I tell you).
In fact, the deeper I dive into things, I realise that approx 50% of systematic momentum alpha comes from shorts!
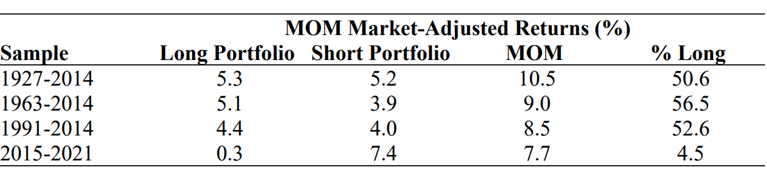
There are various different types of windows and measures of momentum factor. Say if you take away the 12 month return of a security from its 2 month return and then map that on a gradient and you can get a structure for how long alpha may persist from there. Awesome study by HIMCO showing that momentum factor returns last around 14-15 months. The signal period (12 mth vs 7mth) doesn’t change duration of the factor. Why? God who knows!
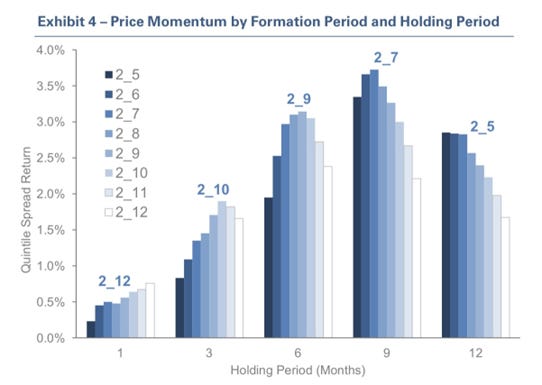
Now back to our fundamental concentrated manager, they allocate a whole bunch of capital to a security which falls a little bit and doesn’t bounce. If you’ve ever deeply looked at an order book, day in, day out, you’ll sometimes see there is some prick selling into every open and close, someone clearly trying to get out.
And if there is persistent selling, at the 2 or 3 month mark, the stock (if large enough) will filter into the bench at some systematic fund. If the fundamental earnings were remotely mediocre (remember, cockroaches never come in ones!), momentum is a sensational factor for generating returns.
Winners and losers persist. Buy stuff that is going up and sell stuff that is going down.
All of a sudden, mister concentrated fundamental manager over here is trying to work out who keeps selling. While the that other seller in market starts watching the stock trade lower and lower as someone (the systematic fund) keeps taking out any volume. Then the seller decides to push the selling harder! And in a few months time you see the “god candle” when mister concentrated fundamental manager admits defeat and sells at the bottom.
Ask your active/fundamental manager about this next time, most don’t even have a view on this.
Technical selling pressure is indeed a bitch.
Really enjoy reading these each month. Would be great to see data longer than 3 years (5/7/10 year). One of my favourite screens is for great long term performance and poor short term.
Fantastic walkthrough of fund performance across asset classes. The observation about GDX still being cheap relative to gold prices is intriguing since miner valuations usually lag but eventualy catch up during extended bull runs. I ran into similar mispricings back in 2020 when miners stayed depresed even as gold rallied past $1900. The gap tends to close once market participants shift from treating it as a safe-haven play to an operational leverage story.