Hi Everyone,
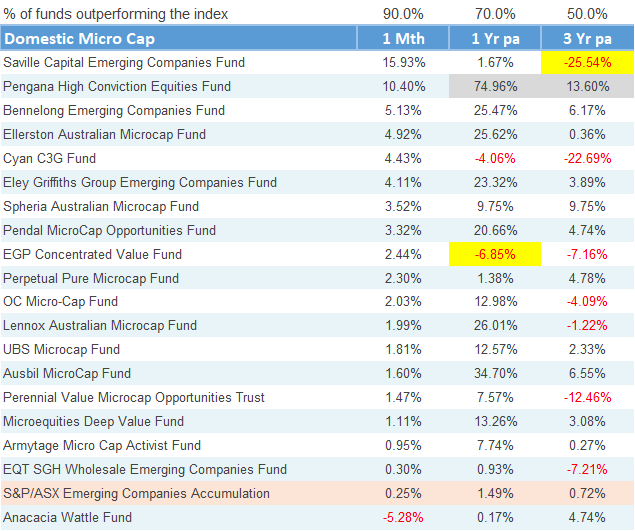
See below month end fund performance data ranked by monthly performance. 1 Year and 3 Year data ranked by:
Best performing funds highlighted in grey
Worst performing funds highlighted in yellow
HOUSEKEEPING
If this forwarded to you, feel free to respond to the Substack email or just send a sign up request on mrquick@substack.com
If you are receiving this via email, I suggest clicking the link and reading directly on Substack. The email formatting does not translate well and the information may appear as clipped or truncated in your inbox due to the size and length of the Substack post.
Fixed Interest
Flight to safety meant duration finally worked as yield curves moved lower
Yet credit also held up very well despite the flight to safety – spreads remain tight as the absolute yield remains very attractive
A question if you read this - where do you allocate? Does it change if markets remain benign? Or if there is a flight to safety? Your options are below:
US BBB corporate effective yield is 5.1%
Aus 10yr Gov Bond is 3.95%
1Yr term deposit is 5% (Judo/AMP/ING/HSBC)
3Yr term deposit is 4.8% (Judo)
FI LICs
Returns are highly influenced by movement in share price rather than movements in the underlying portfolio value.
Despite the wild ride, the 3 year number for these assets are higher than the normal fixed income space covered in the table above – private credit yields have done very well.
I’m going to flag once again that many of these LICs trade above NAV – why would you pay a premium to buy them?
But then again, what other securities readily available that yield so well?
Domestic Large Cap
Ripper of a month, especially for value names as banks and consumer discretionary did well
Active management not really having their time of day – so many underweight the big-4 causing lags
Domestic Mid/Small Cap
Large/Mid/Small cap dispersion on ASX was surprisingly little, EOFY rebalancing flows and relative attractiveness of small/mids? Maybe.
Active management is well and alive here – but note that I’ve use XSO (ASX Small Ords) as the bench. If I use mid cap then less then 30% have outperformed over 3 years.
Domestic Micro-Cap
2 months in a row of unbelievable performance from some funds – seriously where did tax loss selling go this year??
The one benchmark that has lagged the rest of the ASX – quality and makeup of the index leaves a lot to be desired and should be an easy one to beat.
Massive dispersion over 3 years – value biased funds dominating
International Equities
Global SMIDs rally driven by Russell 2000 in the US – reflective of rate cut expectations in the US
Value names otherwise had a great month with the main growth funds lagging MSCI World
Cathy Wood stealing the wooden spoon from Caledonia
Active management
Historically Aussies have been wary of global managers based in Aus as they have not always generated good performance
Magellan’s downfall meant a proliferation of new Aus based global managers – lots of new funds chasing that old Magellan money
But the 1 & 3 Year figures can’t but help make you think – how good is active management in the global equity sector in Aus? Really need to get your manager selection right!
Infra + REITS
Yield curve moved lower and the neat way of expressing a long duration asset moved much much higher.
Look at how consistent returns have been in the infrastructure space over the last 3 years – who would have guessed with rates moving so much higher. Something about inflation linked revenues underpinning good infrastructure assets and real estate.
Other
Levered long and long short equities both doing well last month and over the last year too – being net long was a huge carry for most funds
Market neutral and absolute return funds having a torrid time on the other hand – no market beta and alpha has been hard to come by as rate cuts have been priced in and out of the market a few times over the last year
Hedge funds month returns show you the tough part of holding these vehicles – not for the faint hearted but a benefit to portfolios
Note that I use the price of Gold as the Index here.
Holding a pet rock beat over approx. 90% of funds over 1 and 3 years. KISS?
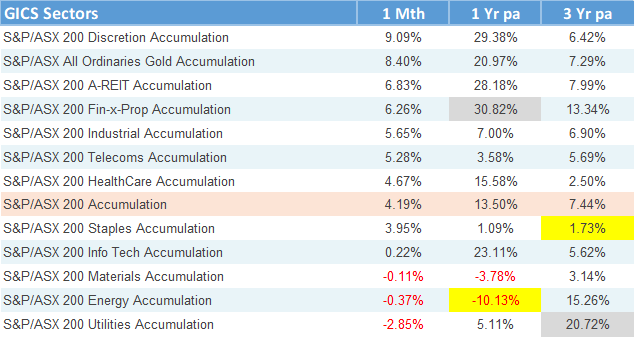
GICS Sectors
Rate cut expectations go up, the beneficiaries all rally in a big big way – weird to see tech all the way down there
Bad news begets bad news – materials not looking so strong
Bonus Round
BTC still up >100% over 1 year. But is the flippening going to happen where gold is going to outperform BTC over 3 years?
ETH looking interesting as ETF flows increasing.
Now that ETFs are available to hold this easily in a portfolio – how long before we see widespread adoption?
Thoughts of the month
Taken for a Joye ride - Part 11
As a reminder, our favourite bearish commenter let everyone know the S&P500 was set up for a “terrible” decade. This is despite there being enough empirical evidence to show that the range of outcomes investing in equities is much higher than investing in fixed income markets. And risk disaggregates over time.
We are going to track whether the S&P500 and ASX200 will outperform his funds over the next 2 years, let alone the next decade.
From 13 Sep 2023 to 31 July 2024:
His fund did well last month but the ASX200 obliterated him.
The Pain Trade – Part 1
Lots of commentators make themselves sound cerebral (and en-Joye-able?) by elucidating a negative view about markets with references to higher unemployment, recessions, volatility and bad times in general. And when markets continue to go up, they claim the “pain trade” is if markets continue to rally persistently.
Over the last 2 months I’ve seen many “market strategists” and commentators, especially from the major US banks, come out and claim the pain trade is equities higher.
I’ll keep beating on about this, but negativity doesn’t pay when investing over the long run and the pain is the egg on the commentator’s face.
Portfolios should be levered to markets continuing to rise (if you’re not in drawdown phase) because everyone is (or should be) inherently long market beta. The real pain trade in reality is always going to be when the market sells off, not when the market goes up.
And having said that, market falls provide opportunity to redeploy capital. But we seem to only get short bursts of market selloffs lasting 2-5 days followed by big rallies at the moment.
Let the good times roll? Or are there opportunities out there in depressed areas?
The Pain Trade – Part 2 – (un)crowded trades
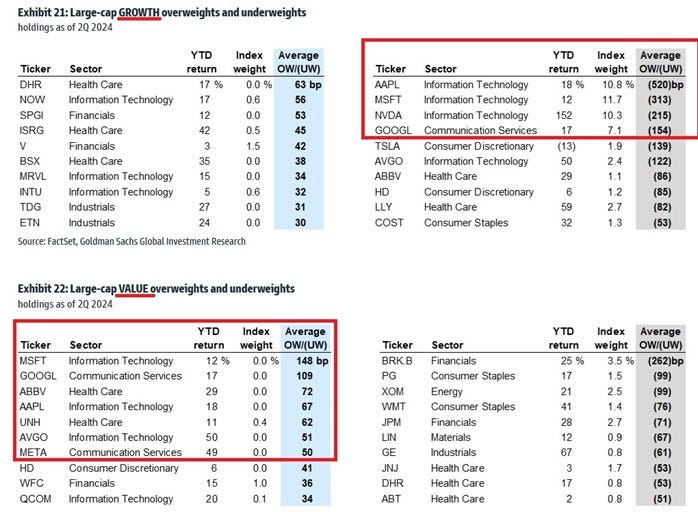
Global funds are underweight US Tech (namely Mag-7) because of the active decision to allocate elsewhere due to valuations. See the earlier table of global equity managers which shows only approx. 30% of global funds beat MSCI World over 3 years?
Data point 1 via Michael Frazis of Frazis Capital Partners (& Morgan Stanley) showing the relative institutional ownership underweight of US tech.
And data point 2 which shows the most insane part - growth funds are on average underweight (!) tech while value funds are overweight (!!) tech. What is going on. Welcome to crazy town.
Global managers being underweight Mag-7 feels like the Aussie large cap managers being underweight financials.
Sounds smart right? Things might go down, there might be volatility, but gee being wrong hurts and tracking error widening while justifying your positions in the face of low fee ETFs eating your pie is another pain trade.
Nuance matters when talking about pain trades, and crowded vs uncrowded positions (among a million other things) can easily drive this rather than talking about global macro and valuation.
I’m yet to find someone who has a consistent edge on global macro and market valuations to drive returns, so why bother listening?
Thanks
Well done for making it this far and it pleases me you are reading this sentence. I thank you for reading the above and I hope it has provoked some thoughts.
Formalities
If you are thinking about starting a new fund, are a new manager or an existing manager, an analyst, or would like your vehicle to be part of the list I track, I’m always keen to chat.
Likewise, if you just want to have a good old chat, I’m always free to do that too :)


Another extremely interesting and informative newsletter. Your tables provide an extremely easy way of comparing performances over both short and longer periods ! They’re much appreciated as are your observations on all things financial.